Educational Performance Analytics for Schools
Transforming academic and behavioral data
into actionable educational insight.

Schools collect data
But insight is often missing
Schools generate significant amounts of academic, attendance, behavioural, and assessment data every day. However, much of this information is often underutilised due to the absence of structured analytical reporting systems.
Academic trends
Difficult to monitor early performance decline
Behaviour & attendance
Risk patterns may go unnoticed
Parent & counselling meetings
Data is often difficult to interpret quickly

Some Educational Analytics Scenarios
The following examples demonstrate how visual data analysis can support educational monitoring, intervention planning, behavioural assessment, and more evidence-based school decision-making.
Scenario 1: Student Progress & Intervention Monitoring
*The Challenge
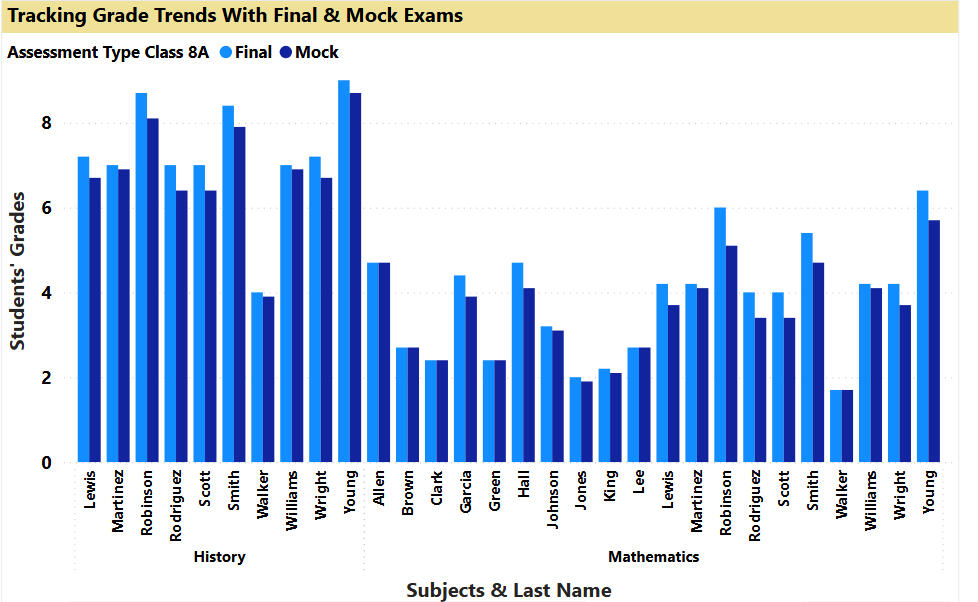
Schools regularly organise intervention and booster classes, but monitoring academic progress, identifying subject-specific weaknesses, and evaluating whether these interventions are truly effective can be difficult.*Data Insight
Tracking mock and final assessment trends and other assessments through visual reporting allows schools to monitor student progress over time, identify weaker subject areas, and evaluate the impact of intervention programmes more accurately.
Combined with prioritised student selection, this approach also helps schools allocate intervention resources more fairly and effectively.*Educational Impact
Supports evidence-based intervention planning, improves monitoring of academic progress, and helps schools make more informed decisions about resource allocation and student support strategies.
Scenario 2 : Behavioral & Academic Risk Analysis
*The Challenge
Behavioral, attendance, and academic issues are often reviewed separately, making early educational risk detection more difficult.*Data Insight
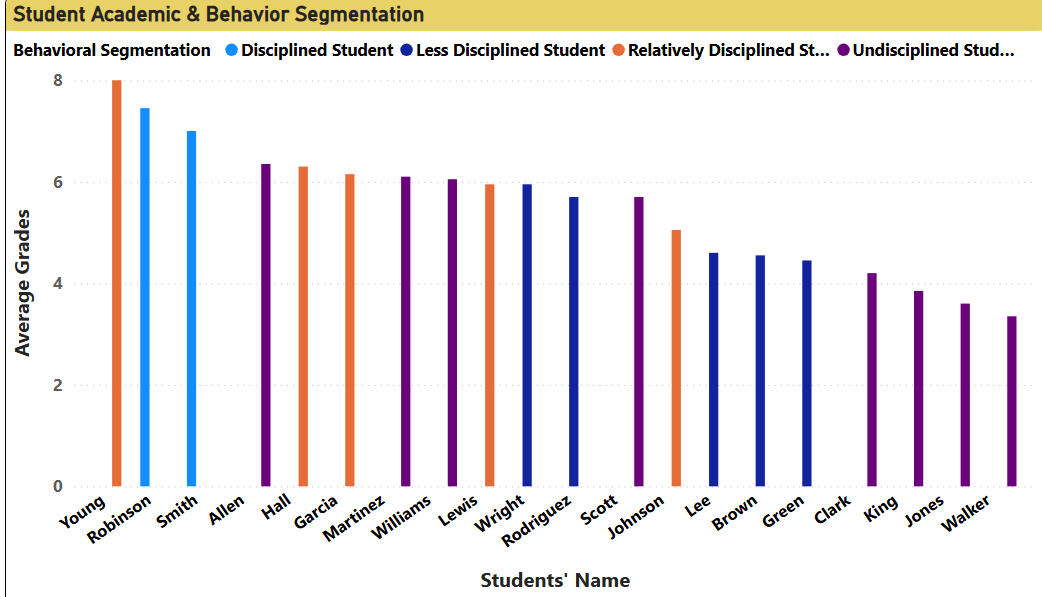
Combining behavioral indicators with academic trends helps schools build clearer student profiles through visual categorisation and reporting.*Educational Impact
Supports more objective educational decisions and helps identify students whose academic performance may not align with their behavioral patterns, For example:academically capable students showing behavioral risk patterns may benefit from mentoring and counselling, while highly disciplined students with weaker academic performance may require targeted academic support.
This allows schools to provide more personalised intervention and use educational resources more effectively.
Scenario 3: Visual Student Performance Reporting
*The Challenge
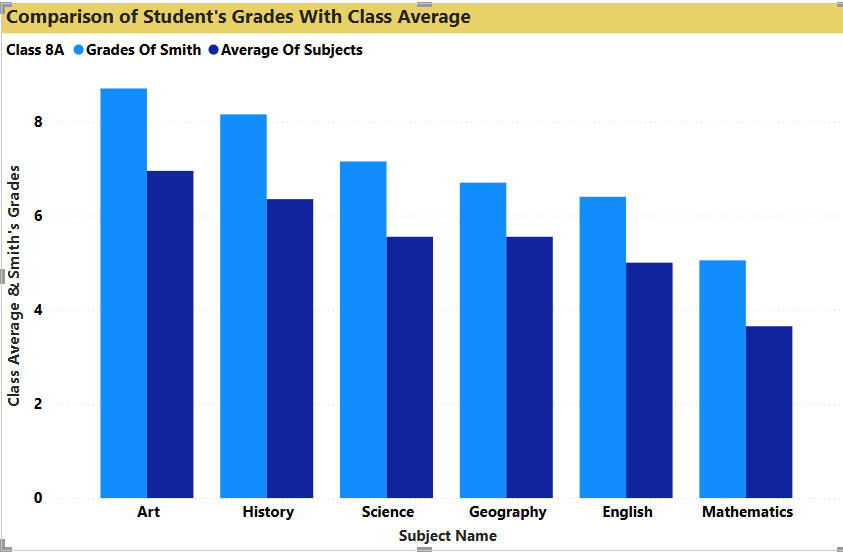
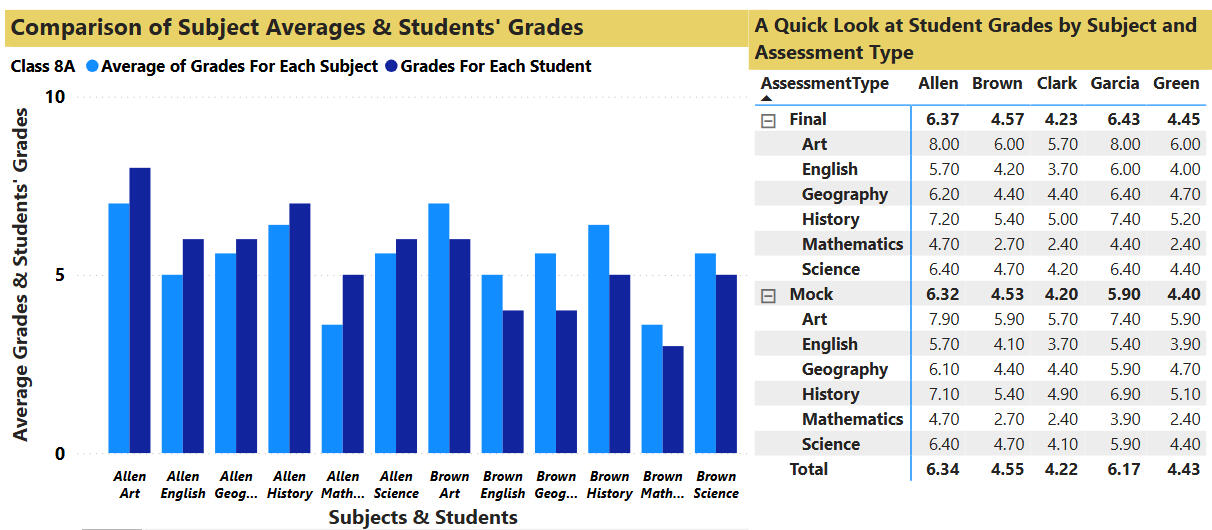
Head teachers, teachers, counselors, and parents often need a quick but meaningful understanding of a student’s academic and behavioral situation.*Data Insight
By transforming student performance, attendance, and behavioral records into clear visual charts and summary reports, schools can monitor student progress more efficiently and communicate concerns more effectively.*Educational Impact
Visual reporting helps educational staff and parents understand student academic situations more clearly, supports faster intervention decisions, and improves the quality of academic and pastoral discussions.